Introduction to Cartography - Lecture 11
Dot Density Maps (Slocum, 1999)
- Dot maps are constructed by letting one dot equal a certain amount of phenomenon, and then locating dots where the phenomenon is most likely to occur.
- Raw-count data are normally the basis for dot mapping.
- If possible, constrict the placement of the dots by variables (their areas/regions) that may influence the dot value.
Advantages of Dot Density Maps
- generally dot maps are easy to understand
- it is an effective way to demonstrate spatial density
Disadvantages of Dot Density Maps
- perception of density is sometimes difficult for the map reader
- with most digital cartographic software there is no control over the placement of dots
- dot density per a given area is tough to map
- it is difficult to construct any original data from the map composition because of the random placement of the dots
Dot Mapping
- centroids are commonly used when the dot represents more than one value over a given area (territorial domain)
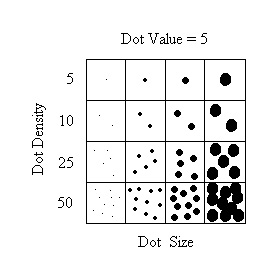
- dot value (weight) and size can be altered to change the appearance of the dot
- dot value is the numerical value represented by each dot
- dot size is the physical space occupied by the dot
- dots should begin to coalesce in the statistical area that has the highest density
- there should be two to three dots in the area of least density
- try not to show zero dots in an area, unless you have no alternative
- select dot values that are easy to understand, i.e., 1 dot = 1,000 individuals is preferred over 1 dot = 971.5 individuals
- by altering dot size and dot value, the cartographer should be able to find an impression that is neither too busy nor too general - Experiment!
- legend design for a dot map can be difficult, many cartographers will utilize a verbal description to designate what each dot represents
- recent digital cartography programs allow the cartographer a new approach by placing representative dot densities in a legend
Dot Mapping Terms
apparent density - the map reader's perception of how many dots are present
visual anchors - legend boxes, which allow the reader a reference, point to examine sample dot densities
dot re-scaling - occurs when dot values are re-assigned new values to compensate for underestimation by the map reader